
|
|
|

|
|
Population and MigrationPopulation (Mid-2012)- 38,146,025
Density (People per sq. km)- 87.21 Met Migration Rate (3 per 1000 people)- 1.5 Birth Rate (# per 1000 people)- 30.9 Death Rate (#per 1000 people)- 3.8 Rate of Natural Increase- 27.1 Population Growth Rate- 2.87 IMR (# of deaths per 1000 live births)- 37.5 TFR (average # of children per woman)- 4.06 Population age <15 %- 39.88 Population Age 65+ %- 3.39 Dependency Rate (<15% + 65+%)- 43.27 Life Expectancy at Birth (total)- 74.9 Life Expectancy at Birth Females- 77.2 Life Expectancy at Birth Males- 72.6 Primary School Completion Rate Males- ** Secondary School Enrollment Net Females- ** Secondary School Enrollment Net Males- ** GNI PPP per capita in US$- 6,550 Economically Active Females 15+-** Economically Active Males 15+- ** Mobile Phone Subscribers (# per 100)- 91 Motor Vehicles (# per 1000)- ** Undernourished Population- ** Underweight Children Under Age 5- 8.5% HIV/AIDS Among People Ages 15-49- N/A |
Gapminder Activity Chart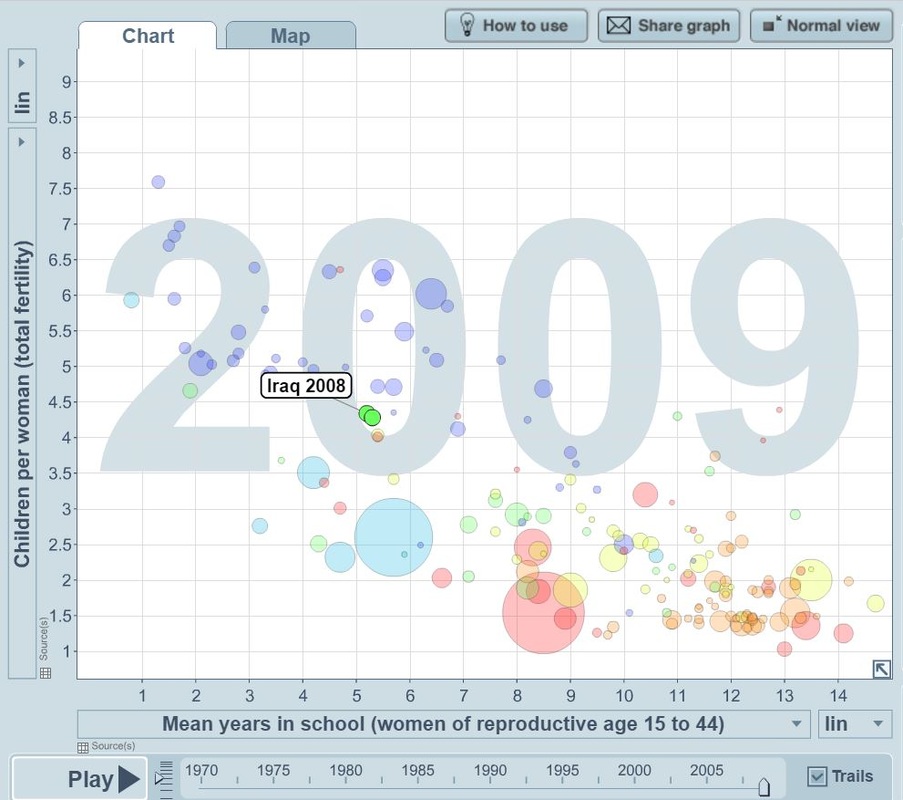
click the image to see an overtime animation
The x-axis of this graph is the average number of years of education that women of child bearing age while and the y-axis of this graph is the number of children per woman of child bearing age. Both of this label were chosen because school of woman does correlate with the amount of children that they bear. Women with more education on average have less children than woman with more education. Because women in Iraq receive only 5 years of education on average, they each have a little over 4 children each on average.
|
Demographic Transition Model
|
|
|
|
